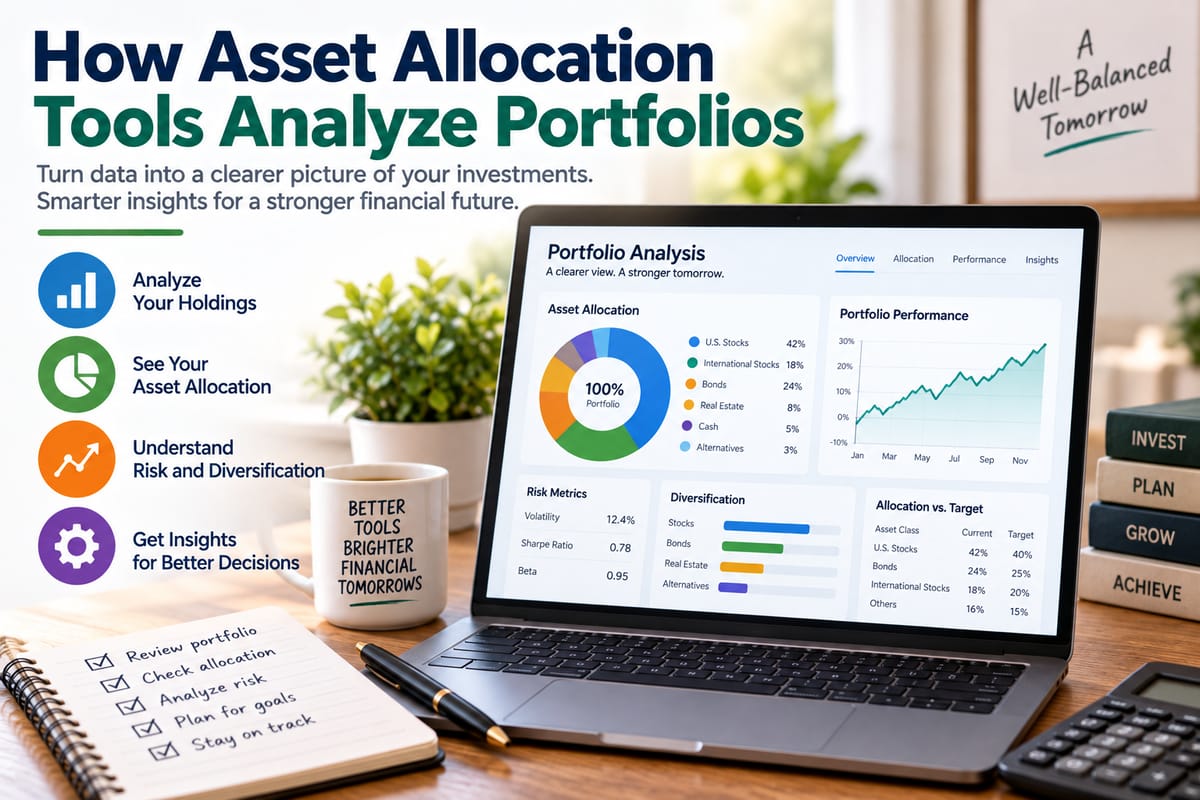
How Asset Allocation Tools Analyze Portfolios
Managing an investment portfolio involves more than choosing individual stocks, bonds, funds, or other assets. Investors also need to consider how those holdings work together and whether the overall mix reflects their objectives, time horizon, and tolerance for risk.
Asset allocation tools are designed to make that process easier. They examine the composition of a portfolio, organize investments into broader asset categories, and show how those categories are distributed. Some tools go further by analyzing diversification, risk exposure, historical performance, and potential changes to the portfolio.
Understanding how these tools work can help investors interpret their results more effectively and avoid treating a software-generated portfolio analysis as a complete investment decision.
What Is an Asset Allocation Tool?
An asset allocation tool is a financial software feature, calculator, platform, or online service that analyzes how investments are distributed across different asset classes.
Depending on the tool, those categories may include:
- Stocks or equities
- Bonds or fixed-income investments
- Cash and cash equivalents
- Real estate
- Commodities
- Alternative investments
- Domestic and international investments
- Large-, mid-, and small-cap stocks
- Different bond maturities or credit qualities
The tool typically takes information about an investor’s holdings and converts it into a portfolio-level view.
For example, an investor might own several mutual funds and exchange-traded funds without realizing that many of them invest in similar companies. An asset allocation analysis can look beyond the individual fund names and show the underlying exposure.
This broader perspective is one reason investment software has become useful for investors managing increasingly complex portfolios. A wider overview of available platforms and services can be found in Understanding Investment Tools and Platforms.
How Asset Allocation Tools Categorize Investments
The first step in portfolio analysis is generally identifying what each investment represents.
A tool may use information such as:
- Security names and ticker symbols
- Fund holdings
- Asset-class classifications
- Geographic exposure
- Industry or sector classifications
- Investment style
- Bond characteristics
- Account balances
- Current market values
The system then assigns investments to categories.
Suppose a portfolio contains three funds. One might primarily hold U.S. stocks, another international stocks, and a third government and corporate bonds. Rather than treating these as three unrelated investments, an allocation tool can combine them into broader categories.
The result might reveal that the portfolio consists of approximately 60% equities, 30% bonds, and 10% cash.
That summary makes the portfolio easier to evaluate at a high level.
Why Portfolio Percentages Matter
The percentage assigned to each asset class provides a quick picture of how the portfolio is positioned.
For example, two investors could each own ten investments but have very different allocations.
Portfolio A
- 80% stocks
- 15% bonds
- 5% cash
Portfolio B
- 45% stocks
- 45% bonds
- 10% cash
The number of holdings alone does not explain the difference in risk exposure. Asset allocation provides another layer of information by showing where the portfolio’s value is concentrated.
Tools often present these percentages through charts, tables, or visual dashboards, allowing investors to quickly identify large allocations.
How Asset Allocation Tools Measure Diversification
Diversification is another important part of portfolio analysis.
A portfolio can contain many investments without being well diversified. For instance, several funds may hold many of the same companies or concentrate heavily in the same sector.
An allocation tool may examine exposure across:
- Asset classes
- Geographic regions
- Market sectors
- Company sizes
- Investment styles
- Individual securities
- Bond categories
This can help reveal concentration that is difficult to see by simply looking at an account statement.
For example, an investor could own multiple technology-focused funds and a broad stock-market fund. Although the portfolio contains several funds, its combined exposure to technology companies may be substantially higher than the investor realizes.
How Tools Analyze Risk Exposure
Many asset allocation tools incorporate risk analysis into their portfolio reports.
The exact methodology varies, but risk analysis may consider factors such as:
- Historical price volatility
- Asset-class behavior
- Correlations between investments
- Portfolio concentration
- Geographic exposure
- Interest-rate sensitivity
- Credit risk
- Equity exposure
Some platforms estimate how much a portfolio might fluctuate under different market conditions.
However, historical data cannot guarantee future results. A portfolio analysis based on past market behavior is useful for understanding potential patterns, but it cannot eliminate uncertainty.
Investors should therefore treat risk measurements as analytical information rather than precise predictions.
The Role of Correlation in Portfolio Analysis
Correlation helps explain how different investments have historically moved relative to one another.
If two assets tend to move in the same direction at similar times, their returns may be positively correlated. If they frequently move in different directions, their correlation may be lower or negative.
Asset allocation tools can use correlation data to evaluate whether combining different investments may provide diversification benefits.
For example, adding an investment with a different historical return pattern may change the overall risk characteristics of a portfolio.
However, correlations can change during different market environments. Assets that historically behaved differently may sometimes decline together during periods of financial stress.
How Tools Compare Current Allocation With Target Allocation
Some portfolio tools allow investors to establish target percentages.
An investor might choose a hypothetical allocation such as:
- 60% stocks
- 30% bonds
- 10% cash
The tool can then compare the current portfolio against those targets.
If the actual portfolio has become 68% stocks and 22% bonds, the software may identify the difference as an allocation drift.
This does not automatically mean the portfolio needs to be changed. It simply shows that the current allocation differs from the selected target.
The decision about whether and how to respond depends on the investor’s objectives, circumstances, and investment strategy.
What Is Portfolio Drift?
Portfolio drift occurs when market movements or changes in holdings cause an investment portfolio to move away from its intended asset allocation.
Imagine an investor starts with equal amounts in stocks and bonds. If stocks increase substantially while bonds remain relatively stable, stocks can eventually represent a much larger percentage of the portfolio.
An allocation tool can detect this change by comparing current percentages with the portfolio’s target allocation.
Some platforms may then provide a rebalancing alert or illustrate possible adjustments.
This can make it easier to monitor a portfolio over time without manually calculating every percentage.
How Rebalancing Analysis Works
Rebalancing generally involves bringing a portfolio closer to its intended allocation.
An asset allocation tool may show:
- The portfolio’s current allocation.
- The investor’s target allocation.
- The percentage difference between the two.
- Which asset categories are above or below target.
- The approximate dollar amount associated with each difference.
For example, if stocks are above their target while bonds are below it, the tool may highlight the imbalance.
Some advanced platforms can model potential transactions, but investors should consider taxes, transaction costs, account rules, and other consequences before making changes.
How Asset Allocation Tools Analyze Multiple Accounts
Investors sometimes have money spread across several accounts, such as retirement accounts, taxable brokerage accounts, and employer-sponsored plans.
Looking at each account separately can make the overall portfolio appear less concentrated than it actually is.
A portfolio analysis tool may combine eligible accounts to create a consolidated allocation.
For example, an investor could hold mostly stocks in one account and mostly bonds in another. Individually, each account may have a particular allocation, but the combined household portfolio could have a different overall balance.
This consolidated view can provide a more complete picture of asset exposure.
How Investment Platforms Support Portfolio Analysis
Asset allocation is usually one component of a broader set of investment tools.
Modern platforms may also provide:
- Investment research
- Portfolio tracking
- Performance reporting
- Watchlists
- Retirement projections
- Risk questionnaires
- Rebalancing analysis
- Tax information
- Financial planning features
Investors can learn more about these capabilities in How Investing Tools and Platforms Help Investors Research and Manage Investments.
Understanding the purpose of each feature is important because a portfolio analysis tool may answer a different question from a retirement calculator or investment research platform.
How Performance Analysis Fits Into Asset Allocation
Asset allocation tools may also show how different parts of a portfolio have performed.
A report could compare:
- Total portfolio returns
- Individual asset-class returns
- Contributions from different holdings
- Historical volatility
- Performance over different periods
This can help investors understand what has driven portfolio results.
However, strong historical performance from one asset category does not necessarily mean it should receive a larger allocation. Past performance and future expectations are different questions.
Portfolio analysis is therefore more useful when performance is considered alongside objectives, risk, diversification, and time horizon.
Scenario Analysis and Portfolio Stress Testing
More advanced asset allocation tools may provide scenario analysis.
Instead of simply showing what happened historically, a tool may estimate how a portfolio could behave under hypothetical conditions such as:
- A significant stock-market decline
- Rising interest rates
- Falling interest rates
- Higher inflation
- Weak economic growth
- Strong economic growth
- Currency movements
Stress testing can help investors think about how different parts of a portfolio might respond to changing conditions.
These scenarios are not forecasts. They are models based on assumptions, historical relationships, or other analytical methods.
The quality of the result therefore depends partly on the assumptions and data used by the tool.
Why Data Quality Matters
An asset allocation tool can only analyze the information available to it.
Problems can occur when:
- Holdings are missing
- Securities are incorrectly classified
- Account balances are outdated
- Fund holdings have not been updated
- Certain alternative investments cannot be categorized accurately
- Multiple accounts are not included
Investors should check whether the information displayed by a platform accurately represents their actual portfolio.
An impressive chart does not necessarily mean the underlying analysis is complete.
Asset Allocation Tools and Financial Calculators
Asset allocation tools are part of a broader category of financial technology.
Other tools may help investors calculate compound growth, estimate retirement needs, compare loan costs, evaluate savings goals, or understand investment returns.
The Complete Guide to Financial Tools and Calculators provides a broader look at how these digital resources can support financial decision-making.
The key difference is that an asset allocation tool focuses primarily on how investments are distributed and how that distribution relates to portfolio characteristics.
How Investors Can Use Asset Allocation Reports
A portfolio allocation report can be useful for answering practical questions.
For example:
- How much of the portfolio is invested in stocks?
- How much is exposed to international markets?
- Is there a large concentration in one sector?
- How much is held in bonds?
- Has the allocation changed significantly over time?
- Are multiple investments providing similar exposure?
- How closely does the current portfolio match the intended strategy?
These questions can help investors organize information that may otherwise be difficult to interpret.
The tool becomes more useful when its results are considered within a broader investment plan.
Connecting Asset Allocation With Long-Term Goals
Asset allocation should generally have a purpose rather than being treated as a collection of arbitrary percentages.
An investor saving for a long-term goal may have different considerations from someone who expects to use the money soon.
Factors that can influence an allocation strategy include:
- Investment time horizon
- Financial objectives
- Liquidity needs
- Risk tolerance
- Existing assets
- Income requirements
- Tax considerations
- Changes in personal circumstances
Investors can explore the relationship between these considerations in How to Build an Investment Plan for Long-Term Goals.
An allocation tool can then help translate part of that strategy into measurable portfolio percentages.
Limitations of Asset Allocation Tools
Despite their usefulness, asset allocation tools have limitations.
Different platforms can produce different results because they may use different asset classifications, data sources, assumptions, and calculation methods.
A tool may also have difficulty analyzing investments that do not fit neatly into standard categories.
Other limitations include:
- Historical data does not guarantee future performance.
- Risk estimates are not certain predictions.
- Diversification does not eliminate investment losses.
- Allocation percentages do not capture every aspect of an investment.
- Automated recommendations may rely on simplified assumptions.
- Tax and transaction consequences may not be fully reflected.
For these reasons, an allocation report should generally be viewed as one source of information rather than the entire investment decision-making process.
Making Portfolio Analysis Easier to Understand
The main advantage of asset allocation tools is their ability to turn complicated investment information into a more understandable portfolio-level picture.
Instead of examining dozens of individual holdings, investors can see how their money is distributed across major asset categories, where concentrations exist, and whether the portfolio has moved away from its intended allocation.
Used thoughtfully, these tools can make portfolio monitoring more systematic. They can also help investors identify questions worth exploring before making changes.
The most useful analysis is not necessarily the one with the most charts or complicated metrics. It is the analysis that clearly shows what the portfolio contains, how those holdings interact, and how the overall allocation relates to the investor’s broader financial objectives.