How the Yield Curve Reflects Economic Conditions
The yield curve is one of the most closely watched indicators in financial markets because it shows how interest rates on bonds vary across different maturities. By comparing short-term and long-term yields, investors and economists can gain insight into expectations about inflation, economic growth, monetary policy, and future borrowing conditions.
The yield curve does not provide a simple forecast of what will happen next. Instead, it reflects the collective pricing decisions of participants in the bond market. Changes in those prices can reveal how expectations about the economy are shifting.
Understanding the yield curve can therefore provide useful context for interpreting changes in interest rates, financial markets, and broader economic conditions.
What Is the Yield Curve?
A yield curve is a graphical representation of interest rates for bonds with different maturities but otherwise comparable characteristics.
When economists and investors discuss the yield curve, they often refer to government bonds because they provide a relatively consistent way to compare borrowing costs across maturities.
For example, a yield curve might compare yields on government securities maturing in:
- Three months
- Six months
- One year
- Two years
- Five years
- Ten years
- Thirty years
The resulting curve shows how much investors demand to lend money for different lengths of time.
The yield curve is therefore closely connected to the broader Complete Guide to Bond Markets, where bond prices, yields, maturities, credit risk, and investor expectations all play important roles.
Why the Shape of the Yield Curve Matters
The yield curve can take several different shapes.
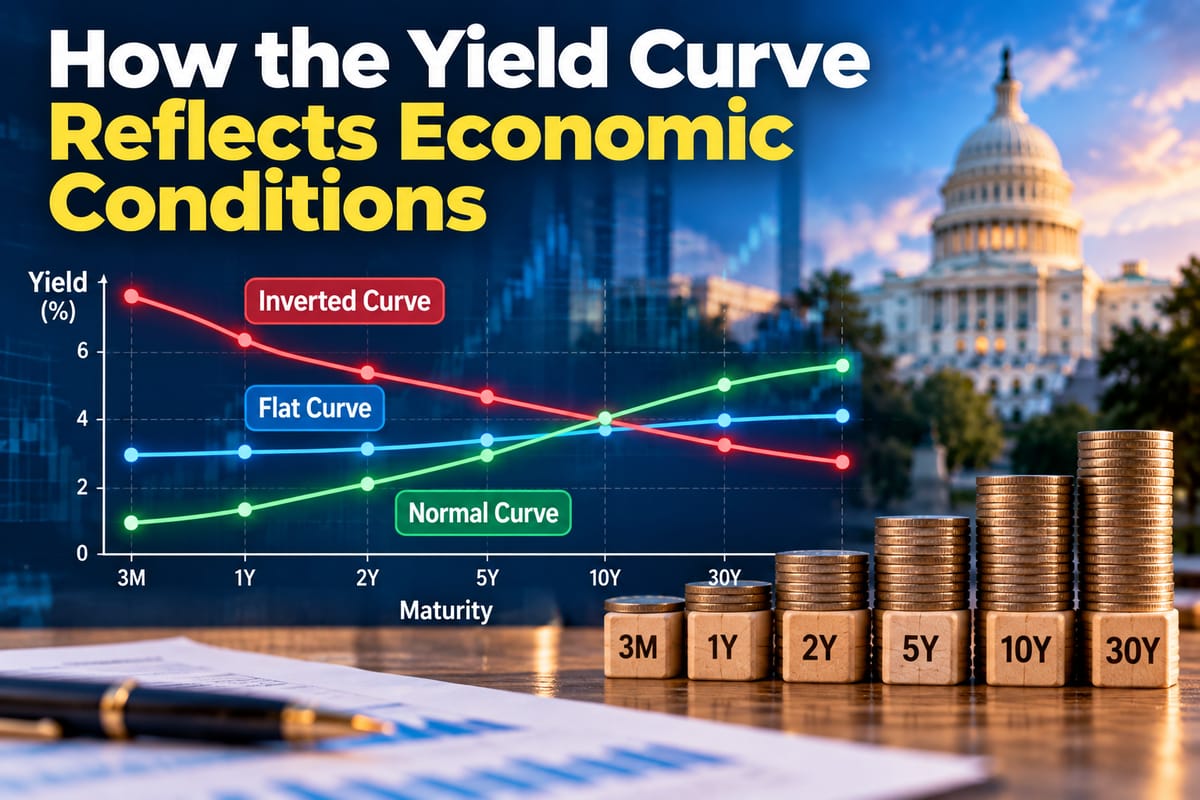
A normal or upward-sloping yield curve occurs when longer-term yields are higher than shorter-term yields. This can happen when investors expect economic growth and require additional compensation for committing their money over longer periods.
A flat yield curve occurs when short- and long-term yields are relatively close together. It can indicate uncertainty about the future direction of interest rates and economic activity.
An inverted yield curve occurs when shorter-term yields are higher than longer-term yields. Historically, some inversions have occurred before economic downturns, although the relationship is not mechanical and the timing can vary considerably.
The shape of the curve is important because it provides a snapshot of how markets are pricing different time horizons.
How Interest Rates Influence the Curve
Central banks have a major influence on short-term interest rates.
When a central bank raises its policy rate, short-term borrowing costs generally increase. Yields on shorter-maturity securities can respond quickly because they are closely connected to expectations about near-term monetary policy.
Longer-term yields are influenced by a broader combination of factors, including:
- Expectations for future interest rates
- Inflation expectations
- Economic growth prospects
- Demand for government bonds
- Global investment flows
- Perceptions of financial risk
- Expected monetary policy over several years
Because these forces do not always move together, short- and long-term yields can change at different speeds.
The Yield Curve and Economic Growth
Economic growth can influence expectations about future interest rates and inflation.
When investors anticipate stronger economic activity, they may expect businesses and consumers to borrow and spend more. Stronger demand can contribute to higher inflation pressures, potentially affecting expectations for future monetary policy.
Longer-term yields may rise when investors expect stronger growth and inflation over an extended period.
However, growth expectations are only one influence on long-term yields. Investors also consider global demand for bonds, fiscal conditions, risk perceptions, and the outlook for monetary policy.
This is why the yield curve should be viewed as one piece of a broader economic picture rather than as a standalone measure.
Inflation Expectations Are an Important Factor
Inflation affects the real value of future bond payments.
If investors expect prices to rise more quickly, they may demand higher yields to compensate for the loss of purchasing power over time. This can put upward pressure on longer-term interest rates.
Changes in inflation expectations can therefore reshape the yield curve even when a central bank’s current policy rate has not changed.
The yield curve can also respond when investors become more confident that inflation will decline. In that situation, longer-term yields may fall if markets begin to anticipate lower future inflation and interest rates.
What an Inverted Yield Curve Can Signal
An inverted yield curve often attracts significant attention because several historical economic downturns have been preceded by periods in which short-term yields exceeded longer-term yields.
One reason is that an inversion can reflect expectations that current interest rates are relatively restrictive and that economic conditions may weaken enough for interest rates to decline later.
For example, investors may expect a central bank to keep rates high in the near term to control inflation but eventually reduce rates as economic activity slows.
An inversion does not guarantee that a recession will occur. The relationship can be affected by unusual monetary conditions, global capital flows, central bank asset purchases, and other market forces.
The signal is therefore best interpreted alongside other economic indicators.
The Yield Curve as Part of a Broader Economic Picture
Economic conditions cannot be measured through a single variable.
Employment, inflation, consumer spending, industrial production, business investment, housing activity, and financial conditions can all provide information about the economy.
The Complete Guide to Economic Indicators provides broader context for understanding how different measurements can be used to evaluate economic activity.
Looking at multiple indicators can help distinguish temporary market movements from broader changes in economic conditions.
How Bond Investors Read Changes in the Curve
Bond investors do not only examine whether the yield curve is upward sloping or inverted. They also monitor how different sections of the curve move over time.
For example, the two-year yield may respond strongly to changing expectations about central bank policy, while ten- and thirty-year yields may respond more heavily to longer-term inflation, growth, and borrowing expectations.
Investors may therefore examine movements between different maturities, such as the spread between two-year and ten-year yields.
Changes in these spreads can provide additional information about how expectations are evolving.
What Is a Steepening Yield Curve?
A steepening curve occurs when the difference between longer- and shorter-term yields becomes larger.
This can happen in several ways.
If short-term yields decline while long-term yields remain relatively stable, the curve can steepen. This may occur when investors begin expecting future monetary policy to become less restrictive.
A curve can also steepen if long-term yields rise more quickly than short-term yields, potentially reflecting changing expectations for inflation, economic growth, government borrowing, or bond demand.
The economic meaning of steepening therefore depends on what is driving the movement.
What Is a Flattening Yield Curve?
A flattening curve occurs when the difference between short- and long-term yields becomes smaller.
This can happen when short-term yields rise more quickly than long-term yields.
For instance, if investors expect a central bank to raise interest rates in response to inflation while remaining less confident about longer-term growth, short-term yields may increase substantially relative to long-term yields.
A flattening curve can also result from falling long-term yields while short-term rates remain relatively stable.
The underlying cause matters because the same change in the curve can reflect very different economic expectations.
Yield Curve Movements and Financial Market Cycles
Economic conditions and financial markets tend to move through changing phases rather than following a perfectly predictable path.
During periods of expansion, expectations for growth, inflation, and interest rates can influence bond yields differently than they do during periods of slowing activity.
The relationship between these changes is explored in How Economic and Financial Market Cycles Work.
Understanding market cycles can help put yield curve movements into context because bond markets are constantly adjusting to expectations about what economic conditions may look like in the future.
How the Yield Curve Relates to Recession Risk
A recession can affect expectations for employment, consumer demand, business investment, inflation, and interest rates.
If investors believe economic activity is likely to weaken, they may anticipate that central banks will eventually reduce interest rates. This can influence short-term and longer-term bond yields differently.
An inverted yield curve has historically appeared ahead of some recessions, making it a closely watched indicator of potential economic weakness.
However, the curve does not specify exactly when a downturn will occur or how severe it will be. The How Recessions Happen and Affect Financial Markets provides additional context on the economic and financial processes involved in recessions.
Why Timing Matters When Interpreting the Curve
One of the most important limitations of the yield curve is that it does not function like a countdown clock.
An inversion may persist for an extended period before economic activity changes significantly. In other circumstances, the curve may shift rapidly as inflation expectations or monetary policy expectations change.
The time between a particular yield curve signal and a subsequent economic development can therefore vary.
This makes it more useful to think of the yield curve as a market-based measure of expectations rather than a precise prediction tool.
The Role of Market Expectations
Bond yields incorporate the expectations and decisions of many investors.
If investors collectively expect stronger inflation, higher interest rates, or faster economic growth, bond prices and yields can adjust accordingly. If expectations change toward weaker growth or lower inflation, the market can adjust in the opposite direction.
This means the yield curve can change before official economic statistics fully capture a shift in conditions.
At the same time, market expectations can be wrong. Investors are constantly responding to incomplete information, unexpected events, policy decisions, and changing economic data.
Why Investors Watch the Yield Curve
The yield curve matters because it connects financial markets with expectations about the economy.
Its shape and movements can provide information about:
- Expected monetary policy
- Inflation expectations
- Economic growth
- Recession concerns
- Demand for government bonds
- Long-term borrowing conditions
- Investor expectations about future interest rates
For businesses and households, changes in market interest rates can eventually influence borrowing costs, investment decisions, mortgage rates, and other financial conditions.
For investors, the curve provides another way to evaluate how markets are pricing economic uncertainty.
Reading the Yield Curve in Context
The yield curve is most useful when it is interpreted alongside other evidence.
An inversion, for example, may attract attention because of its historical relationship with recessions. But analysts can also examine employment trends, inflation, consumer spending, business investment, credit conditions, and other indicators before drawing conclusions about the economy.
Similarly, a steepening curve does not automatically indicate stronger growth. The movement may be driven by inflation expectations, changes in bond demand, fiscal developments, or shifts in monetary policy expectations.
The key is to understand why the curve is moving rather than simply observing its shape.
How the Yield Curve Connects Markets and the Economy
The yield curve provides a useful bridge between financial markets and economic expectations. By showing how borrowing costs differ across maturities, it captures changing views about inflation, monetary policy, growth, and risk.
Its signals are most meaningful when considered over time and alongside other economic indicators. A changing curve can reveal that investors are reassessing the future, but interpreting that change requires understanding the forces behind it.
For anyone following financial markets, learning to read the yield curve provides a practical way to understand how expectations about the economy are reflected in bond prices and interest rates.