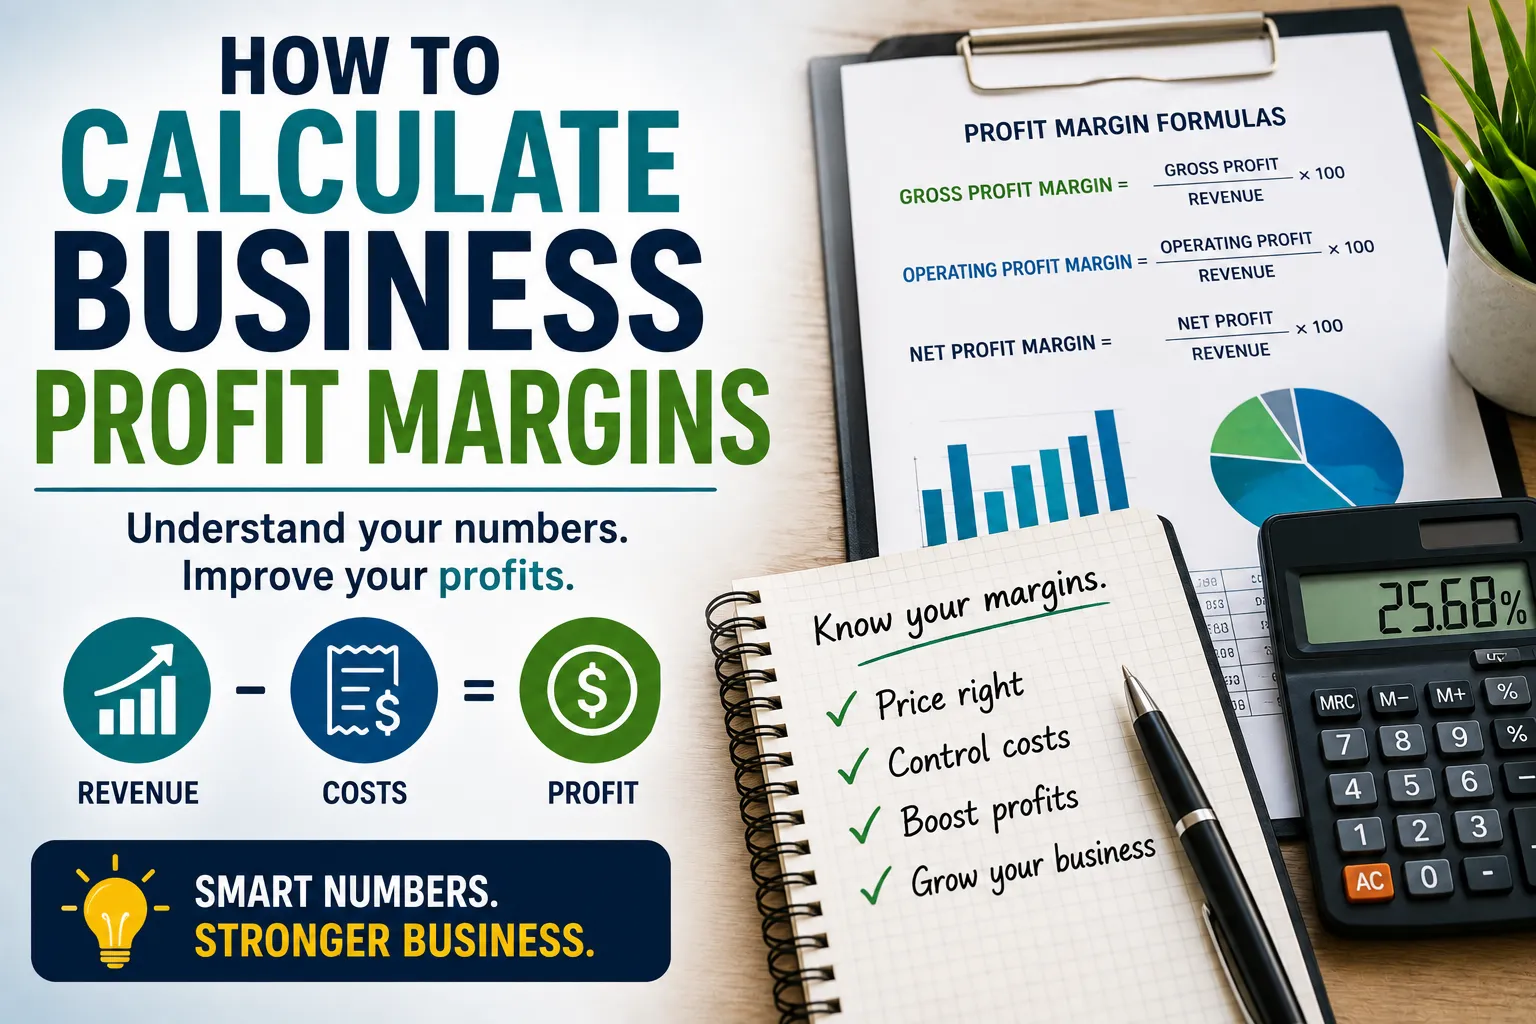
How to Calculate Business Profit Margins
Profit is one of the most important measures of business performance, but simply knowing how much money a company makes does not tell the whole story.
A business can generate millions in sales and still struggle financially if its costs are too high. Another company with much smaller revenue may be considerably more profitable because it keeps a larger share of every dollar earned.
That is where profit margins become useful.
Profit margins show how much of a business’s revenue remains after certain costs are deducted. They can help business owners understand whether pricing is sustainable, identify areas where expenses are eating into earnings and compare performance across different periods.
Understanding how to calculate profit margins is therefore an essential financial skill for entrepreneurs, managers and anyone trying to build a more profitable business.
For a broader look at building income through independent work, business ownership and other approaches, see the complete guide to freelancing and independent work.
What Is a Profit Margin?
A profit margin is the percentage of revenue a business keeps as profit after subtracting expenses.
The basic formula is:
Profit Margin = (Profit ÷ Revenue) × 100
For example, suppose a business generates $100,000 in revenue and has $80,000 in expenses.
Its profit is:
$100,000 − $80,000 = $20,000
The profit margin is:
($20,000 ÷ $100,000) × 100 = 20%
That means the business keeps 20 cents in profit for every $1 of revenue after the expenses included in the calculation.
However, there is more than one type of profit margin.
The three most commonly discussed are gross profit margin, operating profit margin and net profit margin.
Why Profit Margins Matter
Revenue tells you how much money comes into a business.
Profit margin tells you how efficiently the business turns that revenue into profit.
This distinction matters because increasing sales does not necessarily mean increasing profitability.
Imagine two businesses:
- Business A generates $500,000 in revenue and earns $25,000 in profit.
- Business B generates $300,000 in revenue and earns $60,000 in profit.
Business A has significantly higher sales, but Business B is more profitable relative to its revenue.
Business A’s profit margin is:
($25,000 ÷ $500,000) × 100 = 5%
Business B’s margin is:
($60,000 ÷ $300,000) × 100 = 20%
The second business is generating less revenue but keeping a much larger percentage of what it earns.
Gross Profit Margin
Gross profit margin measures how much money remains after subtracting the cost of goods sold (COGS) from revenue.
The formula is:
Gross Profit = Revenue − Cost of Goods Sold
Then:
Gross Profit Margin = (Gross Profit ÷ Revenue) × 100
Suppose a clothing business generates $200,000 in sales and spends $90,000 purchasing or producing the products it sells.
Its gross profit is:
$200,000 − $90,000 = $110,000
Its gross profit margin is:
($110,000 ÷ $200,000) × 100 = 55%
The company therefore has a 55% gross profit margin.
What Counts as Cost of Goods Sold?
COGS generally includes costs directly associated with producing or acquiring the products or services being sold.
Depending on the type of business, this could include:
- Raw materials
- Inventory purchases
- Manufacturing costs
- Direct production labor
- Packaging directly associated with products
- Wholesale product costs
- Certain direct service-delivery costs
The exact treatment can vary by business and accounting method.
For that reason, businesses should use consistent accounting practices when calculating and comparing margins.
Why Gross Margin Is Useful
Gross margin can tell a business owner whether the underlying product or service is economically attractive before considering broader operating expenses.
If gross margin is declining, possible causes include:
- Rising supplier costs
- Increased production costs
- Excessive discounts
- Lower selling prices
- Product mix changes
- Higher shipping or direct fulfillment costs
A business may therefore use gross margin to evaluate pricing and purchasing decisions.
Operating Profit Margin
Gross profit does not account for all the expenses involved in running a business.
A company may have a healthy gross margin while spending heavily on:
- Salaries
- Rent
- Advertising
- Software
- Insurance
- Administrative expenses
- Utilities
- Professional services
Operating profit accounts for many of these expenses.
The formula is:
Operating Profit = Gross Profit − Operating Expenses
Then:
Operating Profit Margin = (Operating Profit ÷ Revenue) × 100
For example, imagine a business with:
- Revenue: $500,000
- COGS: $250,000
- Operating expenses: $150,000
Gross profit:
$500,000 − $250,000 = $250,000
Operating profit:
$250,000 − $150,000 = $100,000
Operating profit margin:
($100,000 ÷ $500,000) × 100 = 20%
The company has a 20% operating profit margin.
Net Profit Margin
Net profit margin provides a broader view of what remains after the business accounts for its expenses.
Depending on the accounting presentation, net income can reflect items such as:
- Operating expenses
- Interest expenses
- Taxes
- Depreciation
- Other income or expenses
The basic formula is:
Net Profit Margin = (Net Profit ÷ Revenue) × 100
Suppose a business generates $1 million in revenue and has $900,000 in total expenses.
Net profit:
$1,000,000 − $900,000 = $100,000
Net profit margin:
($100,000 ÷ $1,000,000) × 100 = 10%
The company keeps 10 cents from every dollar of revenue as net profit.
Gross Margin vs. Operating Margin vs. Net Margin
These three measures answer different questions.
| Margin | Basic calculation | What it helps measure |
|---|---|---|
| Gross profit margin | Gross profit ÷ revenue | Profitability after direct costs |
| Operating profit margin | Operating profit ÷ revenue | Profitability after operating expenses |
| Net profit margin | Net profit ÷ revenue | Overall profitability after applicable expenses |
Looking at all three can provide a much clearer picture than relying on one number.
For example, a business might have a strong gross margin but a weak net margin because its administrative, financing or other expenses are unusually high.
How to Calculate Profit Margin From a Financial Statement
If you have an income statement, calculating profit margin is relatively straightforward.
Start by identifying:
- Total revenue
- Gross profit, if available
- Operating profit, if available
- Net income
Then divide the relevant profit figure by revenue and multiply by 100.
For example:
Revenue: $750,000
Gross profit: $375,000
Operating profit: $120,000
Net income: $80,000
Gross profit margin:
($375,000 ÷ $750,000) × 100 = 50%
Operating profit margin:
($120,000 ÷ $750,000) × 100 = 16%
Net profit margin:
($80,000 ÷ $750,000) × 100 = 10.7%
Each number tells a different part of the story.
How to Calculate Margin for a Single Product
Businesses can also calculate the margin on individual products.
Suppose you sell a product for $80.
The direct cost of purchasing or producing it is $50.
Gross profit per unit is:
$80 − $50 = $30
Gross margin is:
($30 ÷ $80) × 100 = 37.5%
The product therefore has a 37.5% gross margin before other business expenses are considered.
This can help businesses compare products and determine which offerings generate the strongest contribution to overall profitability.
Profit Margin Is Not the Same as Markup
Markup and profit margin are frequently confused.
They are related, but they use different bases.
Suppose a product costs $60 and sells for $100.
The profit is:
$100 − $60 = $40
Profit Margin
Profit margin is calculated using the selling price:
$40 ÷ $100 × 100 = 40%
Markup
Markup is calculated using the cost:
$40 ÷ $60 × 100 = 66.7%
So a product with a 66.7% markup has a 40% margin.
This distinction is extremely important when setting prices.
How to Calculate the Selling Price From a Desired Margin
Suppose a product costs $60 and you want a 40% profit margin.
You cannot simply add 40% to the cost.
Instead, use:
Selling Price = Cost ÷ (1 − Desired Margin)
So:
$60 ÷ (1 − 0.40) = $100
The required selling price is therefore $100.
At that price:
$100 − $60 = $40 profit
And:
$40 ÷ $100 = 40% margin
This is different from adding a 40% markup, which would produce a selling price of only $84.
Why Small Margin Changes Can Matter
Profit margins can have a significant impact on the amount of money a business ultimately keeps.
Imagine a company with $1 million in annual revenue.
At a 5% net profit margin, it earns:
$1,000,000 × 5% = $50,000
At a 10% margin:
$1,000,000 × 10% = $100,000
At a 15% margin:
$1,000,000 × 15% = $150,000
The difference between a 5% and 15% margin is $100,000 in this example.
That is why improving profitability does not always require dramatically increasing sales.
Reducing unnecessary costs or improving pricing can sometimes have a substantial effect.
How Pricing Affects Profit Margins
Pricing is one of the biggest factors affecting margins.
If your selling price increases while costs remain unchanged, your margin generally increases.
If your price decreases while costs stay the same, your margin generally falls.
However, raising prices can reduce demand in some markets.
The goal is therefore not simply to charge the highest possible price.
Businesses need to find a price that reflects:
- Customer value
- Competition
- Costs
- Brand positioning
- Demand
- Product quality
- Market conditions
A strong pricing strategy balances profitability with customer demand.
How Discounts Affect Margins
Discounts can quickly reduce profit margins.
Suppose a product sells for $100 and costs $60.
The original gross margin is 40%.
Now imagine offering a 20% discount.
The new selling price becomes:
$100 × 0.80 = $80
The profit becomes:
$80 − $60 = $20
The new margin is:
$20 ÷ $80 × 100 = 25%
A 20% price discount therefore reduces the gross margin from 40% to 25% in this example.
This demonstrates why businesses should carefully calculate the financial impact of promotions rather than assuming higher sales volume will automatically compensate for lower prices.
How Lower Costs Can Improve Margins
Businesses can sometimes improve margins by reducing costs without raising prices.
Potential areas to examine include:
- Supplier pricing
- Inventory waste
- Shipping expenses
- Labor efficiency
- Software subscriptions
- Advertising efficiency
- Energy use
- Packaging
- Payment-processing costs
- Administrative expenses
The objective should not be to cut costs indiscriminately.
A cost reduction that damages product quality or customer service can create bigger problems later.
The better approach is to identify expenses that provide limited value relative to their cost.
Calculate Margins by Product or Service
Looking only at total company profit can hide important differences.
Imagine a business sells three products:
| Product | Revenue | Gross Profit | Gross Margin |
|---|---|---|---|
| A | $100,000 | $50,000 | 50% |
| B | $200,000 | $60,000 | 30% |
| C | $50,000 | $30,000 | 60% |
Product B generates the most revenue but has the lowest margin.
Product C generates the least revenue but has the highest margin.
This information can help management evaluate pricing, marketing and product strategy.
However, gross margin alone should not determine which products deserve investment. Sales volume, operating costs, customer acquisition costs and strategic importance also matter.
Consider Customer Acquisition Costs
For businesses that spend heavily on marketing, product margin is only part of the picture.
Suppose you sell a service for $500 and have a gross profit of $300.
That looks attractive.
But if it costs $250 in marketing and sales expenses to acquire each customer, the remaining contribution is much smaller.
Businesses should therefore understand how acquisition costs interact with margins.
A high-margin product can still be difficult to scale if attracting customers is extremely expensive.
Profit Margin and Break-Even Analysis
Profit margins can also help with break-even analysis.
A business reaches its break-even point when its revenue covers its relevant costs without producing a profit or loss.
For a simplified business with fixed costs and a known contribution margin, a common formula is:
Break-Even Sales = Fixed Costs ÷ Contribution Margin Ratio
Suppose:
- Fixed costs = $50,000
- Selling price = $100
- Variable cost = $60
Contribution per sale:
$100 − $60 = $40
Contribution margin ratio:
$40 ÷ $100 = 40%
Break-even revenue:
$50,000 ÷ 0.40 = $125,000
The business would need approximately $125,000 in sales to cover those fixed costs under these assumptions.
Watch Margin Trends Over Time
One profit margin figure is useful.
A series of figures is much more informative.
Suppose a business reports:
- January: 18%
- February: 19%
- March: 17%
- April: 15%
- May: 13%
The trend suggests profitability is deteriorating even if total revenue is still increasing.
Management can then investigate why.
Possible explanations include:
- Rising costs
- Price reductions
- Increased discounts
- Changes in product mix
- Higher labor costs
- Increased shipping expenses
Tracking margins over time can help identify problems before they become more serious.
Compare Margins With Similar Businesses
A margin should not be judged in isolation.
Different industries naturally operate with different cost structures.
A grocery business may have a very different margin profile from a software company, consulting firm or construction company.
Even within one industry, businesses can have different margins because of differences in:
- Business model
- Geography
- Scale
- Product mix
- Brand positioning
- Customer base
- Distribution strategy
Industry comparisons can provide context, but they should not replace analysis of the individual business.
Higher Revenue Does Not Always Mean Better Performance
Consider two years for the same company.
Year One
Revenue: $500,000
Profit: $75,000
Margin: 15%
Year Two
Revenue: $700,000
Profit: $70,000
Margin: 10%
Revenue increased by $200,000.
But profit declined by $5,000.
The business became larger but less profitable.
This is why revenue growth should always be considered alongside profit and margin.
Rapid growth can sometimes create additional expenses that reduce profitability.
Higher Margins Do Not Always Mean a Better Business
The opposite can also be true.
A business with a high margin may have limited growth opportunities, high customer concentration or other risks.
Another company may deliberately operate with lower margins while investing heavily in expansion.
Therefore, margin should be considered alongside:
- Revenue growth
- Cash flow
- Debt
- Customer retention
- Return on investment
- Market position
- Operating efficiency
No single financial metric tells the entire story.
Common Mistakes When Calculating Profit Margins
Several mistakes can make margin calculations misleading.
Mixing Revenue and Profit Periods
Use revenue and expenses from the same reporting period.
Forgetting Certain Costs
A business may calculate a “profit” that excludes important expenses.
Confusing Markup With Margin
Remember that markup uses cost as the base, while margin uses revenue.
Comparing Different Accounting Methods
If two businesses classify expenses differently, their reported margins may not be directly comparable.
Ignoring Discounts and Returns
Revenue should reflect the appropriate accounting treatment of discounts, returns and allowances.
Focusing Only on Revenue
Strong sales do not guarantee strong profitability.
Use Consistent Calculations
Consistency is particularly important when tracking performance.
If you calculate your margin one way in January and use a different definition in June, the comparison becomes less meaningful.
Define what you include in:
- Revenue
- COGS
- Operating expenses
- Net expenses
Then apply the same methodology over time unless there is a legitimate accounting or reporting reason to change it.
A Simple Profit Margin Calculation
For a small business owner who wants a straightforward monthly measure, the process can be as simple as:
Step 1: Calculate total revenue.
For example:
$25,000
Step 2: Calculate the relevant profit.
For example:
$5,000
Step 3: Divide profit by revenue.
$5,000 ÷ $25,000 = 0.20
Step 4: Multiply by 100.
0.20 × 100 = 20%
Your profit margin is therefore 20%.
The important part is making sure the profit figure includes the costs appropriate to the type of margin you are calculating.
Using a Spreadsheet to Track Profit Margins
A simple spreadsheet can make margin analysis easier.
Useful columns might include:
| Month | Revenue | COGS | Gross Profit | Operating Expenses | Net Profit | Net Margin |
|---|---|---|---|---|---|---|
| January | $20,000 | $8,000 | $12,000 | $7,000 | $5,000 | 25% |
| February | $22,000 | $9,000 | $13,000 | $7,500 | $5,500 | 25% |
| March | $25,000 | $11,000 | $14,000 | $8,500 | $5,500 | 22% |
This makes it easier to identify changes in profitability.
A declining margin alongside rising revenue can be a warning sign that costs are growing too quickly.
Ways to Improve Business Profit Margins
Once you understand your margins, you can look for opportunities to improve them.
Potential strategies include:
Review Pricing
Determine whether your prices accurately reflect costs and customer value.
Reduce Waste
Identify inventory, materials or processes that create unnecessary expenses.
Negotiate With Suppliers
Higher purchasing costs can directly reduce gross margin.
Improve Operational Efficiency
Look for processes that consume significant time without creating proportional value.
Focus on Profitable Products
Understand which products and services generate strong margins.
Reduce Unproductive Marketing Spend
Measure marketing results rather than simply increasing advertising budgets.
Improve Customer Retention
Retaining existing customers can sometimes be less expensive than continuously acquiring new ones.
Automate Repetitive Tasks
Appropriate technology can reduce administrative workloads and improve efficiency.
Be Careful About Cutting Costs
Improving margins does not mean cutting every possible expense.
Some costs support long-term growth.
Reducing customer service staff might lower expenses temporarily but damage retention.
Using cheaper materials might increase short-term margins while reducing product quality.
Cutting marketing entirely might reduce immediate spending while weakening future sales.
The objective is profitable efficiency, not minimum spending.
Business owners looking beyond immediate profitability may also benefit from understanding how to build scalable income over time, particularly when considering how a profitable operation can grow without increasing costs and labor at the same rate.
Profit Margin and Cash Flow Are Different
A profitable business can still experience cash-flow problems.
Profit is an accounting measure.
Cash flow describes the actual movement of money into and out of the business.
For example, a company may record a sale today but not receive payment for 60 days.
The sale can contribute to accounting revenue and profit while the cash has not yet arrived.
This distinction is particularly important for growing businesses.
A healthy profit margin does not guarantee that a company has enough cash available to pay its bills.
What Is a Good Profit Margin?
There is no single profit margin that qualifies as “good” for every business.
A reasonable margin depends on:
- Industry
- Business model
- Scale
- Competition
- Capital requirements
- Growth strategy
- Operating costs
- Risk
- Location
Instead of chasing an arbitrary percentage, compare your margin with your own historical performance and appropriate industry benchmarks.
A business whose margin consistently improves from 8% to 12% may be making excellent progress even if another industry typically operates at much higher margins.
Use Margins to Make Better Business Decisions
Profit margins become particularly useful when they influence decisions.
Before launching a product, estimate its expected margin.
Before offering a discount, calculate how the lower price will affect profitability.
Before hiring another employee, consider how the additional cost affects operating margin.
Before expanding into a new market, estimate whether expected revenue justifies the additional expenses.
Before dropping a product, examine its contribution to profit rather than looking only at sales volume.
Financial calculations become valuable when they change the quality of decisions.
The Bigger Picture Behind Every Percentage
Calculating a business profit margin is mathematically simple.
The basic formula is:
Profit Margin = (Profit ÷ Revenue) × 100
But understanding what the percentage means requires more thought.
Gross margin can show whether products or services generate enough money after direct costs. Operating margin can reveal how efficiently the business manages its broader operations. Net margin provides a wider view of what ultimately remains after applicable expenses.
For business owners, the real value of margin analysis comes from using these numbers to understand where money is being made, where it is being lost and what can be changed to improve profitability.
A business does not necessarily need the highest revenue in its market to succeed. It needs a sustainable model in which the money coming in is sufficient to cover costs, generate an appropriate return and provide the resources needed to keep growing.
Once you know your margins, you can stop looking at sales as the only measure of success and start asking a more important question: How much of every dollar earned is the business actually keeping?